Many maps we look at these days reveal depressing information – rate of COVID infections, which counties are voting Trump, that your UberEats delivery is late.
But not this one. No, this map here reveals which regions boast the most spectacular fall colours. Right now, for example, at time of writing, Wasaga Beach is peak viewing territory.
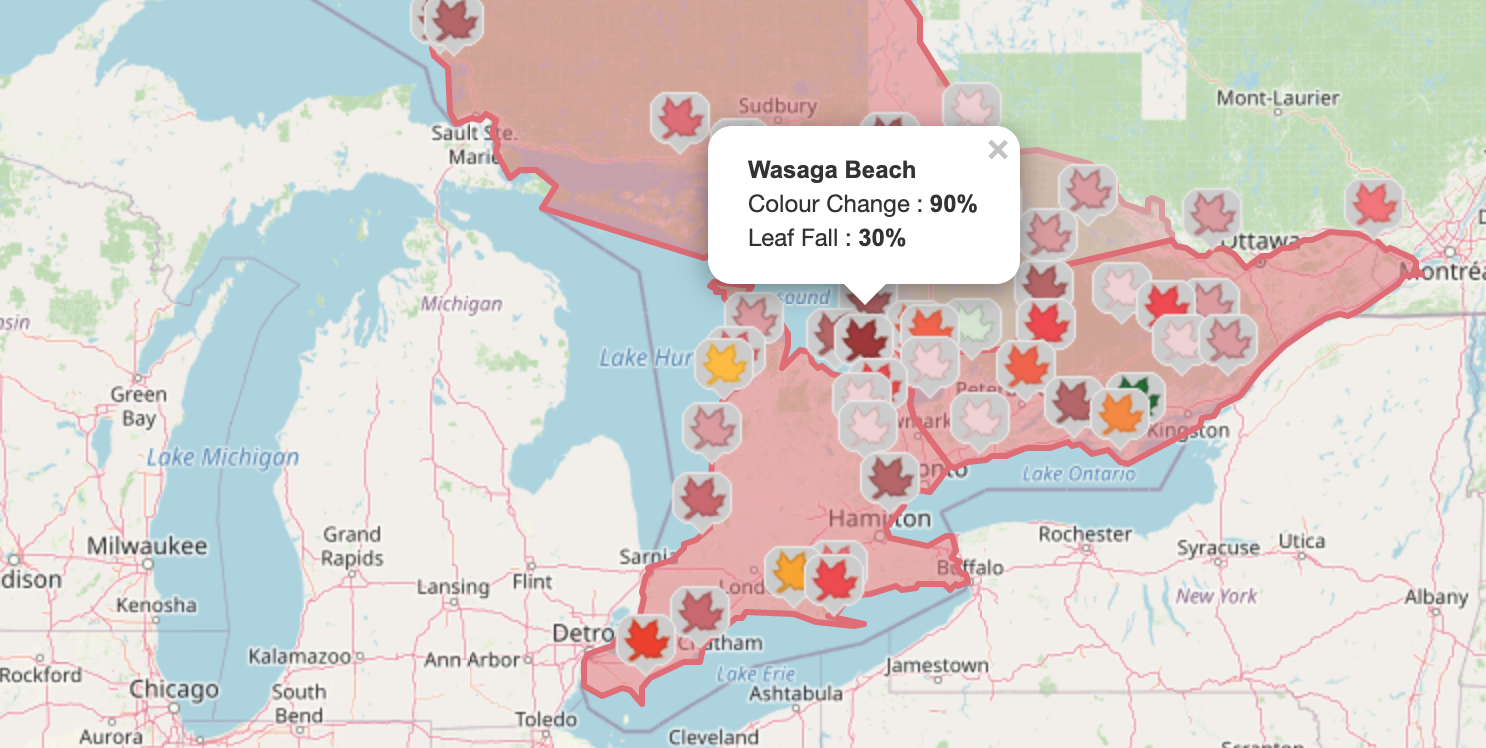
The map is based on sound methodology: The colour of the leaf icon is representative of each specific park and its fall colour report. The colour of each region is determined by averaging all parks within that region.
There are also reports for almost every park. That way you know not to waste your time in Algonquin, where “many trees have lost their leaves entirely.” More promising is Rondeau, where “fall colours have really begun!”
Fun fact: there are even some cone-bearing trees that change colour. Check it out:
Park visitors are encouraged to tweet their foliage findings to @OntarioParks with the hashtag #FallColours. I’d like to take this opportunity to mention how excellent a Twitter feed it is.
Happy gazing.